Sand, salt, and iron

Sand. Salt. Iron.

Sand. Salt. Iron.

Mix the three together. Make the students separate them. Even better, make them figure out how to separate them before beginning. This is how I spice up an otherwise quite boring section on types of mixtures.

The content covered

  1. Compounds and elements (Which substances are elements? Which are compounds? How can you tell?)
  2. Physical properties (What are each substances' properties? How does knowing that allow you to separate them?)
  3. Types of mixtures (Are they mixed heterogenously? Homogenously? How can you tell?)
  4. Good lab practices (How can you work to recover as much of each substance as possible?)
  5. Calculating percent composition

Pre-lab

Once students write out a brief procedure of how they might separate the sand, salt, and iron from each other¹, I give them the lab procedures, go over proper filtration, boiling, and scale techniques, then have them complete a short pre-lab activity. The goal of the pre-lab is to go over proper laboratory techniques and how to calculate the percent composition of a mixture.

During the lab

Students receive a sample of the mixture, mass it, and then use a magnet wrapped in clear plastic wrap to take out the iron filings. They mass the iron filings then toss them. The students then add water to the remaining sand and salt mixture in order to dissolve the salt. Then using a funnel and filter paper, they filter out the sand. At this point they have wet sand in the filter and salt water in a beaker. They break out the hot plates in order to boil off the salt water (leaving the salt residue) and heat the sand to dryness. Once they mass the dried sand and salt, they're essentially done save for calculating the percent of the mixture recovered and the percent composition of the mixture.

Post-lab

We break out the laptops, put our data into a spreadsheet and go over how to make charts using Excel. For most freshman, this seems to be the first time they've officially been taught how to do this. We go over their findings, and they turn it in.

Take away

  1. It's not an overly difficult lab. It is complex. There are a lot of steps. Most freshmen students haven't had much lab experience, and as such their lab skills aren't too advanced. Many students this year didn't get very close to the actual composition of the mixture. A few ended up with more mass at the end than at the beginning (probably didn't drive off all the water in the sand or salt). Given their inexperience in the lab, these results aren't surprising, but I want them to improve their lab techniques as the year goes on. I have to keep reminding myself to be patient with them when they make bone-head moves².
  2. This. lab. takes. for. ever. It took my freshmen about 150 minutes to complete it. It can take 40 minutes simply to boil off the water to extract the salt. That comes down to a lot of time watching water boil. I used 150 mL beakers this time around, but perhaps if I used a larger beaker (400 mL, perhaps) the water would vaporize more quickly.
  3. For all my attempts to spice up the mixture section, students complained sitting and watching water boil wasn't that interesting (big surprise). Next time I'll give them less of the mixture to separate and use larger beakers.
  4. Is it worth my time to teach them how to graph in Excel? This first time through, students were all over the place. Some had never touched a spreadsheet before. Others were decently experienced. Some were done in 5 minutes, others took 40. I'm torn on whether I should spend the time teaching them this, yet I always seem to come out and do it. As we use Excel more, the difference between novices and the experienced gets smaller, which is one of my arguments for keeping it in.

The Schtuff

  • Lab sheet (WORD) (PDF)
  • Pre-lab (WORD) (PDF)
  • Post-lab (WORD) (PDF)
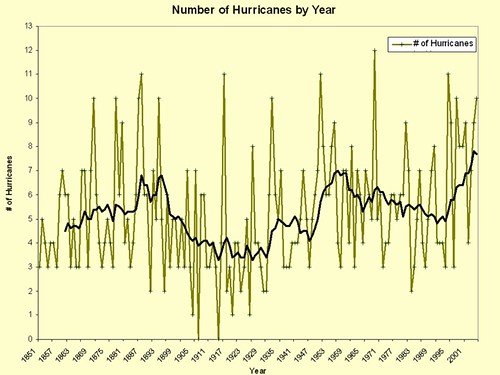
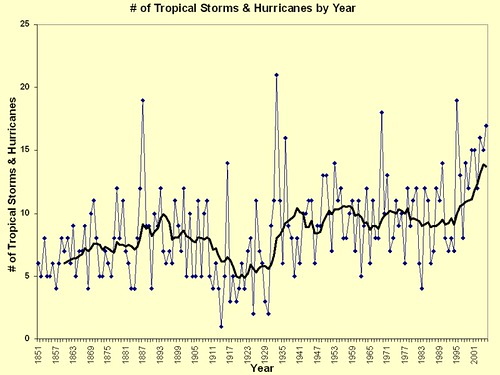
  • Graphs (PDF)
    • I used the third graph as an example to take students through the Excel graphing procedure before they made their own graph.

________________________________________________________________

¹ I require students to write a procedure on how they might separate all three and then weigh the recovered mass of all three dry solids. The dry part throws them a bit sometimes.

² Exception: If they're compromising safety rules, it's a slightly different story. Learning how to properly filter a mixture is something that understandably takes some practice. Learning to not touch the hot plate while it's on doesn't.

________________________________________________________________

Image Credits:

Interesting Finds, Vol. 2 (dy/dan edition)

Forgoing the list of several items, this item deserves a post of its own.

geometry.mrmeyer.com

Dan Meyer has posted his entire geometry curriculum online for everyone to see. He included his presentations in PowerPoint, Keynote, and .pdf format, and has .pdfs for all of his handouts. In my opinion, this takes some real huevos (if you know what I mean). He's opening himself up to major criticism on things he's obviously spent hundreds, if not thousands, if not hundreds of thousands of hours creating. I'm not even really into geometry that much, yet I spent a couple hours perusing his stuff (and thinking it quite good, by the way). For all the criticism he may have received over the years for not giving homework or being to much of a smart alec, regardless of your feelings you've got to give him some high marks for throwing his stuff out there for anyone to use.

This raises the obvious question: Why isn't everyone doing this? I realize not all teachers have the digital know-how to post their creations online, but it seems like an obvious thing to do. It makes me feel silly for not doing it.

I've created lots of material for classes in the last six years, and am constantly working on more. Perhaps I should work on finding a way to share more of that to the world.

Dan: I'm awed by your openness and dedication to sharing your knowledge with the rest of the teaching community. Bravo!

Ready for day 1

Despite the problems I've been having lately with my new position, I feel (mostly) ready to go for day one. As part of my continuing crusade against my previously poorly designed presentations and handouts, I decided to peruse what my blogosphere (the one in my aggregator) had to say about the matter. I found plenty of great stuff, which is nearly inevitable given the quality of educators out there sharing. Here's my plan:

Getting to know you

I've always felt teachers often spend too much time explaining who they are, or what the course is, or what the rules are right away on the first day. I knew my first day plans would focus first on who my students are, then work my way into expectations and procedures.

I vaguely recalled an old post on dy/dan where a beginning of the year "get to know you" activity was shared that struck me as not being stupid.¹  It took me awhile to re-find it (luckily Google Reader had a pretty good search), but upon finding it I knew I had something. I had to track back to his original post from 8 months earlier in which he posted the original blank document.

Here's my version of the document:

Silly Bus

I really dread going over the syllabus every year. It's boring. It's so not a good indicator of what the course is about. But, we're required to have them, so lucky for me, in the same post where Dan introduced the above activity, he shared his more interesting syllabus. It required student participation, it looked good, and as Dan mentions, is different from the 47² other syllabi they've received that same day. At minimum, I figure a different syllabus will earn a couple cool points with students on the first day of school.

Here's my effort (blank):

And then...

I believe my fellow teachers generally go right into lab safety³, so I figure I'd better follow their lead at this point, since I'm still the relatively ignorant rookie. Instead of just reading each of the rules and making students sign their safety contracts, I figure I'll split them into pairs/threes and have each group design and create a safety poster explaining a rule of the lab. Then each group can come up, explain their poster and the importance of their rule, and we're not all bored to death.

Good reading

A few (other) good reads regarding the first day(s) of school I've found:

  • FirstDay Wiki
    • created by the aforementioned Dan Meyer, it has several good ideas for opening day, and you can add your own if you'd like.
  • An Open Letter to Teachers
    • from Bud the Teacher, a motivational post on getting ready for the new year. Read it.
  • What's matter?
    • Doyle does such a great job of verbalizing (textualizing perhaps) science as a process. Science as not a set of memorize-able facts. This post on something he's done the first day of school regarding how matter isn't all we typically think it is makes me want to use his idea, but I'm not sure I could carry it out in the expert way he's described.
  • Do it the right way, not the Wong way
    • Tom in his typically cynical tone nails problems with the "classic" book The First Days of School by Harry Wong. This post in itself probably contains more valuable information for new teachers than the entire book.

_________________________________________________________

¹ I guess I'm not a big ice-breaker fan. Perhaps it comes from my somewhat introverted nature. I've always hated ice-breakers.

² 47 may be a slight exaggeration, but you get the idea.

³ Communication between everyone teaching my classes has been pretty slim, so this is based upon my best guesses.

Awesome Video of the Week, Vol. 1

In addition to my interesting finds series, I'm starting this series which will include a video of something I found compelling, awesome, or interesting each week. They may be videos that are educationally useful or they may just be too awesome to not share with the world.

This first video's narration is in Japanese, and I don't know what's being said, but it still fits into both of those categories: educational and awesome (crazy awesome): The Goblin Shark

Besides the immediate (for me) connection between the Goblin Shark and the alien from the Alien movie series, this video can lead to some interesting discussions in a science classroom. Why did this species of shark evolve its special jaw mechanism? What type of terrain/environment/other factors led this crazy jaw mutation to be selected over the more standard type of shark jaw?

Taken further, this could lead into students "designing" their own crazy creatures, with the caveat that whatever crazy appendages or features their creatures have must be defended with an explanation of how these specific mutations would provide the creatures with evolutionary advantages over other animals competing for resources in the same ecosystem. You might even be able to work this type of assignment into using this game, but I haven't worked out the specifics of that quite yet.

Telling a Story

Rocks

If you poll my students on what they feel is the most boring subject matter in geology, you would almost certainly hear: "rocks." Let's face it, even for this teacher with a degree in geology, rocks aren't the most compelling of subjects. Now, let's imagine you need to cover a whole assortment of technical information¹ about rocks. It's not exactly a teacher's dream subject matter.

We (students, teachers, Homo sapiens) don't pay attention to boring things (Brain Rule #4). As an educator, it's my job to convey information to individuals that may not initially be interested in the material. Professionally, some of my favorite moments are when I can successfully connect students to material that is often considered above their heads or too "academic."

RadioLab

Earlier this week I was listening to the RadioLab podcast of Robert Krulwich's commencement speech at CalTech this spring. In the speech, Mr. Krulwich makes the argument that the new graduates shouldn't be afraid to explain to non-science people what they do with their lives. Not only that, he makes the case that these young scientists should use metaphors, examples, and basically explain the technical information through telling a story.

Mr. Pebbles

Mr. PebblesSo, how do you connect students to technical rock information? Why, through telling the saga of Mr. Pebbles², of course! Mr. Pebbles is a pebble (surprise!) who goes through a crazy journey of being melted, reformed, and then dragged through the rest of the rock cycle. I made a little (poorly drawn) comic strip³ depicting Mr. Pebbles' travel (and travail), which just happened to touch upon the required content. I worried it would be to "kiddie" for my high school sophomores, but they enjoyed it. They enjoyed it enough that I had them create their own comics later on in the unit.

Stories add emotion and connect listeners to the subject matter. Connecting content to students is something that educators, regardless of subject, are (hopefully) trying to do.
_______________________________________________________________

¹ i.e. Fractional crystallization, partial melting

² Yes. I drew that.

³ Which I unfortunately don't currently have in a digital format

Final Exam Projects- Day 2

I've made the switch. This year I've been using a cumulative project in lieu of a traditional written test, and at this point I believe that the projects are a better indicator of student knowledge than the old examinations.

Students have just started working on their final projects for the 3rd Trimester. So far, I'm impressed. Day 1 is usually always a bit of a waste. Students aren't sure what they want to do or how to start so they end up doing lots of email checking, Google Image labeling, Impossible Quiz taking, and other things that are probably violating their AUP's. Day 2 is when the action happens (for most). They figure out what format they're going to use for their exam, and start to frame how they're going to include the required information into that format. About 25% of the projects I've seen from students so far look like they're going to be great. I don't mean simply deserving of an "A." I mean they look like they'll be shiny monuments to mountains of knowledge!

A couple things I've learned to do as I've done more of these cumulative projects:

  • Push for more than just bulleted points of information. It's dull to read, it's dull to write, it's just dull.
  • Demand diagrams, graphs, graphic organizers, and media-rich projects. These are more interesting than text, and they generally demonstrate a student's understanding of a topic more clearly.
  • Require projects to show the student's understanding of how the material covered in the class is interconnected. We covered volcanoes & plate tectonics this trimester. I want them to show me how they relate.

If you'd like to see the project description and rubric for the 3rd Trimester final exam, visit my school homepage. There are links to the rubric and a brief explanation of what is expected. Let me know what you think. What would you add? How might it be structured differently?

Hopeful for great student presentations!

One day, I'd really like to see an erupting volcano. Yes, I'm planning at some point to visit Hawai'i and see Kilauea erupting in classic basaltic shield volcano style, but I'd really like to see a massive, ash cloud, explosive, Plinian eruption. Of course, I'd like the guarantee of being perfectly safe in doing so. 🙂

Kilauea Eruption

We're covering volcanoes in class right now, and as a cumulative project for the volcanic activity topic, I have each student select a different volcano (I provide a list of volcanoes that have either been active fairly recently or have had some spectacular eruptions in the past), and then create a presentation as if they were a travel agent trying to "sell" a trip to their volcano to adventure travelers. They're required to have specific information about the type of volcano it is, how it erupts, etc., but they're highly encouraged to take it to the next level by including trip itineraries, cool things to do near the volcano, and so forth.In the past I've been deluged with presentations from bullet-point hell in which students simply read directly off their slides. It stinks sitting through one 5-minute presentation like that. Imagine sitting through 85-90...yeah, I was going crazy by the end of the presentations- trying as hard as I could to not punish students going later for my self-created forced torture of watching poorly designed presentations for four class periods.

This year, I made a small (but extremely significant) change. I told them they could only have 2 words MAX on each slide- and it'd be fine with me if their presentation contained no text at all (except for citations, of course). I mean it too. Most students created a title slide that looked something like this:

Nope. Can't do that. Volcano name, plus "by: your name" counts as four words (I did concede that the name of their volcano only counts as one word, otherwise whoever covers Mount St. Helens wouldn't even be able to put the name of their volcano on a slide). The classes are in the middle of designing their presentations right now, and it's been a struggle for them:

"How can I give a presentation with no words?"

"You mean I have to memorize everything?"

"What do you mean 'of' is a word? That shouldn't count, it's barely two letters!"

Students can have note cards with information for the presentations with them while they present, so they don't have to memorize, though it's amazing to me that they've been so "well"-trained at designing poor presentations. Students are still in the middle of designing presentations as I type this, and I must say they're looking pretty promising. I'll let you know how they turn out!

Resources:


Image Credit: Kilauea in 1993 from the USGS

Blogged with the Flock Browser

Tags: , , , , , , ,

Tropical Storm and Hurricane Frequency

September, 2005: The school year has just begun. The country is still reeling from Hurricane Katrina.

Instead of beginning the year covering plate tectonics (my original plan), I decide to start with hurricanes. As we learn more about Katrina and hurricanes in general, the question keeps coming up in class (and in the media): "Are we getting more hurricanes because of global warming?"

I struggled with how to answer that question. Reports from scientists were mixed. The most reliable sources (IMHO) never made a direct connection between global warming and the trend of more active hurricane seasons. They'd only go as far as something similar to, "hurricanes get their power from warm oceans. In theory, if oceans get warmer, it would make sense we'd see more hurricanes."

That didn't cut it for my students. 15-year olds don't have great appreciation for the subtleties and complexities of meteorological research. They wanted answers.

I stumbled across a website containing records of every reported hurricane and tropical storm from 1851 on. Aha! Oho! Forget the experts, let's track the trends ourselves!

I split the class into groups. Each group took a decade and recorded the number of hurricanes and tropical storms each year in their decade. Back in the pre-Google Docs era, we were forced to spend 30 minutes or so sharing data and entering into their individual spreadsheets. Today, just create a Google Doc spreadsheet (like this one!) and have each group enter their data (an example of collaborative online documents saving a huge amount of time & boredom).

Then comes the graphing! . I've found Google Docs graphs aren't too great at this now (they might get there soon), but exporting the data to Excel is easy enough.

We added moving average trendlines to see the trends. You can play with how long the moving average should be. We decided that 5-10 years seemed to give a good picture of the trends. The graphs below have trendlines with a moving average of 10 years.

The graphs:

Hurricanes by Year

Tropical Storms + Hurricanes per Year

Fun fact: The first time I saw these graphs was in class (and my students knew that). I didn't know what trends would emerge. My students and I were learning together, and they seemed to like participating in the discovery of something that wasn't pre-determined.

Good discussions that fit well with this activity

  • How valid are the counts and intensities for tropical storms before reliable weather satellites and radar were in use? Most storm reports back in the day simply came from ships at sea. How would the data be affected if several storms went unreported each year?
  • Does this information prove causality? (It doesn't) As much as it looks like it, there's no way we can say with any certainty that global warming has caused the uptick in tropical storms recently.
  • Would coastal development have occurred at the same rate the last 50 years if hurricanes were as frequent as they have been the last few years? Lots of good discussion can be had as to the wisdom of living on the coast, students seem to have strong opinions one way (you'd be stupid to do this) or another (It's way worth the risk to live on the ocean).

Whew. I'm feeling a bit like this guy. What can I say? I'm a fan. Comment it up!

Image credit: NOAA via GISUser.com on Flickr

Blogged with the Flock Browser

Tags: , , , , , , ,