Pipe Insulation Roller Coasters: Rolling Friction

Fair warning: This isn't a description of the pipe insulation roller coaster (a.k.a. PI Coaster) project. It is the activity we did immediately before starting on the roller coasters.

The PI coaster project was one of those quality projects that students enjoyed while still requiring solid content knowledge. I last used this project in 2008- the last year I taught physics. I'd like to think that I've grown as a teacher since then, so I decided I should update it to be what I'd expect of a project from myself today. You know. SBG-it up. Throw in some video analysis. Etc. Suddenly I found myself driving to the local hardware store to pick up some pipe insulation at 9:30 at night.

The Goal

The goal of this activity is to find the coefficient of friction acting between the marble and the track. By the time we get started on this project, we would have already gone over kinematics, F=ma, friction, and uniform circular motion in class, and we'd be right in the middle of the Work & Energy unit.

Specifically, the following concepts are needed for this investigation:

  • Energy may change forms, but is conserved (minus any work done by friction):

    [latex, size=2]\Sigma E_{first} = \Sigma E_{last} - W_{fr}\(\)

  • The size of the frictional force depends on the coefficient of friction between the two surfaces and the weight of the object:

    [latex, size=2]F_{fr}=\mu F_N\(\)

    Solving for work done by friction and doing a little substitution for the energies:

    [latex, size=2]W_{fr}=mgh - \frac{1}{2}mv^2\(\)

    [latex, size=2]W_{fr}=(0.0045 \text{ kg})(9.8 \text{ m/s}^2)(0.75\text{ m})- \frac{1}{2}(0.0045\text{ kg})(1.720\text{ m/s})^2\(\)

    Then solving for the friction force:

    [latex, size=2]W_{fr}=F_{fr}\cdot d\(\)

    [latex, size=2]F_{fr}=\dfrac{0.034\text{ J}}{3.66\text{ m}}\(\)

    Solving for the average coefficient of friction:

    [latex, size=2]F_{fr}=\mu_rF_N\(\)

    [latex, size=3]\mu_r=0.21\(\)

    Then finding the coefficient of friction:

    [latex, size=2]F_{fr}=\mu_rF_N\(\)

    [latex, size=3]\mu_r=0.0066$$

    "Wait, what? That's two orders of magnitude smaller!" That's what I said when I first got that number. Then I realized I this method was calculating$latex \mu_r$only for a straight and level section of the track. You'd expect the friction to be much less along a straight track than when the marble's being forced to do loops and turns.

    Is it worth it?

    Using video analysis is more time-consuming, but I also think it helps students see more clearly that the coefficient of friction between the marble and the track is constantly changing. I think I'd have to try this out with students once or twice before deciding whether it's an effective use of class time. The basic concepts are covered sufficiently using my old method, though they're fleshed out in more detail using video analysis.

    Additionally, I think I'd have each group of students use a different track configuration- one with two loops, one with S-curves, etc. That'd give us an even better idea of how the track layout will effect the friction between the marble and track.

    The Pipe Insulation Roller Coaster Series

    1. Pipe Insulation Roller Coasters: Rolling Friction
    2. Pipe Insulation Roller Coasters
    3. Pipe Insulation Roller Coaster Assessment


    1. If anyone would like to chip in for the Buy Ben a High Speed Camera Fund, let me know. 🙂     []

Learning Tracker Video Analysis with Napoleon Dynamite

I know I'm late to the game. Rhett Allain, John Burk, Frank Noschese, among many others have been sharing how they use Tracker (or a similar tool) to analyze the physics of videos. Since I'm working on picking up my teaching certification in Physics this year, I figure this would be a nice addition to the teaching toolbox1.

So, what is Tracker? It's a free and open-source video analysis and modeling tool designed to be used in physics education. It works on Macs, PCs, and Linux boxes. Logger Pro is a similar tool, but it's not free or open-source2.

Getting going

To begin, I watched Rhett Allain's video tutorial, but it includes a few more complicated pieces that I wasn't quite ready for. Luckily sitting in the Related Videos sidebar on YouTube was this tutorial, which went over the super-basics for n00bs like myself. Alright. Tracker downloaded & installed. Basic tutorial viewed. Now I need me a video to analyze.

I wanted something pretty easy to break myself in: a fixed camera angle, no panning, with an object moving directly perpendicular to the camera. I figured YouTube must be full of videos of people jumping bikes, and I went out to find my first video analysis victim. Amazingly, one of the first videos I found was both interesting, funny, and had the perfect still camera and perpendicularly-moving object:

Perfect! OK, now I needed to calibrate Tracker so it can accurately determine scale. Hmm...well Napoleon is standing fairly close to the sidewalk. I wonder if Jon Heder's height is online? Well, of course it is. In fact, Google gives me an estimated height right on top of the search results by just typing in height Jon Heder. However, I think I'll use IMDb's data, which lists his height at 185cm (sans 'fro).

Napoleon Dynamite's height
Calibrating size with Napoleon Dynamite

There might be a small error there since he is standing a few feet back from the ramp, but it should be OK.

Did Pedro get, like, 3 feet of air that time?

It took me awhile to realize that I needed to shift-click to track an object...once I figured that out things went smoothly. I tracked the back tire of Pedro's bike. Here's a graph of  the back tire's height vs. time:

There are a couple hitches in the graph. A few times the video would advance a frame without the screen image changing at all. Must be some artifact of the video. I added a best-fit parabola to the points after the back tire left the ramp. Hmm...the acceleration due to gravity is -8.477 m/s^2. That's a bit off the expected -9.8 m/s^2. That could be a result of the hitches in the data, my poor clicking skills, or my use of Napoleon Dynamite's height as my calibration. We'll go with it, since it's not crazy bad.

Coming up to the ramp the back tire sits at 0.038m and reaches a maximum height of 0.472 m. How much air does Pedro get? ~0.43m, or 1.4ft. Napoleon's estimate is a little high.

Maybe Napoleon meant Pedro's bike traveled forward three feet in the air? Let's check the table.

I highlighted the points of interest. We can look at the change in x-values from when the tire left the ramp (at 0 meters) until the tire lands back on the sidewalk (at y = 0). The bike traveled 1.3 meters while airborne; about 4.25 feet. So maybe that's what Napoleon meant.

Who was faster?

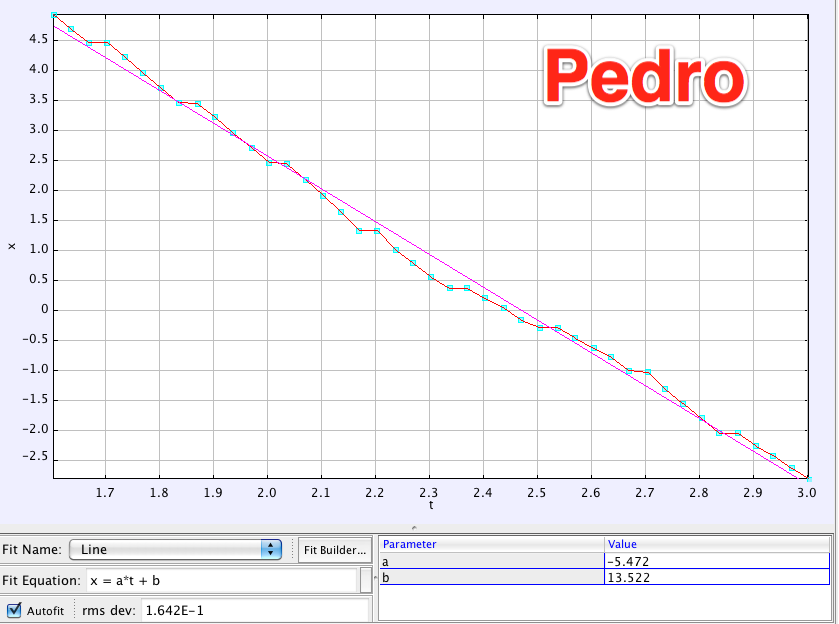
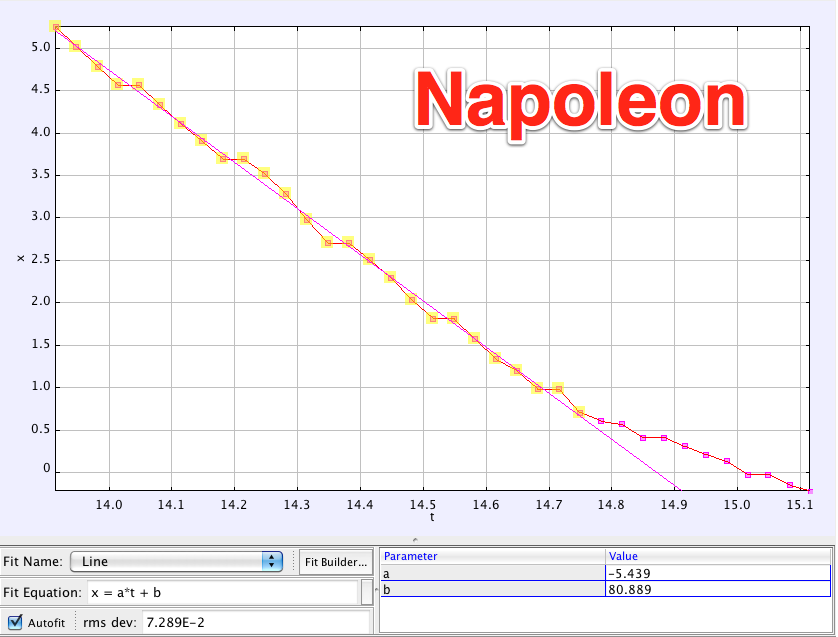
Let's check the position-time graphs for Pedro and Napoleon.

I added best fit lines to both sets of data. We can easily compare their velocities by checking the slope of their best fit lines.

  • Pedro's velocity: 5.47 m/s (12.24 mph)
  • Napoleon's: 5.44 m/s (12.16 mph)

If I account for potential errors in measurement, their velocities are basically the same. Though if forced to pick a winner, I'd Vote for Pedro.

How tall is Pedro?

It should be fairly straightforward to find Pedro's height using the data in the video. The first thing I need to do is verify that the camera angle is exactly the same when Pedro is standing behind the sidewalk as it was earlier. After switching back and forth between the two parts, it's pretty clear that the camera angle is a little different. Nuts.

So, I need to find and measure an object that is visible in both parts of the video. I chose the left window on the (Pedro's?) house. Going to the first part of the video where I'm pretty sure the calibration is accurate, I used the measuring tape to measure the height of the window. I got 1.25 meters.

Jumping to the second part, I calibrated the video by setting the height of the window to 1.25 meters. Then I used the measuring tape to determine Pedro's height. I got 1.67 meters, or about 5' 6". Seems like a reasonable result. Let's compare it to what the Internet says about Pedro's height. IMDb gives Efren Ramirez's (a.k.a. Pedro) height as 1.70 meters (5' 7").

Not too shabby for my first time using Tracker.

Bonus

http://www.youtube.com/watch?v=kr7djGY1fhA

  1. You might notice this post is pretty similar in style to Rhett Allain's video analyses on Dot Physics. Well, it is. When just learning how to do something, it's always best to start by imitating the masters, right? Oh, if you haven't yet, you should definitely check out his many, many amazing examples using video analysis to learn all sorts of crazy things. The guy's a Tracker ninja.     []
  2. To be fair, it's only $189 for a site license of Logger Pro, which ain't too shabby. According to Frank Noschese, Logger Pro is a little more user-friendly. Tracker has a bit of a learning curve.     []

Adventures in Engineering: What makes a quality project?

Some of the best times I've shared with students in a classroom have involved projects where they're making something. Not making as in making letters appear on a worksheet, as in building some object that needs to accomplish some task or solve some problem. There's something about working on a physical product that clearly demonstrates success or failure that resonates strongly with students.

As part of my attempt to make this site seem all professional and stuff, I proudly announce...wait for it...a series of blog posts tentatively titled:

Adventures in Engineering!

Here's what you can expect:

  1. A description and analysis of projects I've done in the past that involved engineering. I've been pretty bad about sharing these, so there are quite a few that have been wildly successful that I've never written about.
  2. Thoughts on engineering in the science classroom. Maybe you noticed that I previously asked for teachers to have their students fill out a survey related to engineering. That hasn't been forgotten, and I'll get to the results of the survey as part of the series. If you haven't had your students fill out the survey
    yet, don't fret, the survey is still open!
  3. Maybe, just maybe, I'll design brand new projects and share them out for criticism and critique. In fact, do you have any units that are badly in need of a project? Let me know in the comments and maybe I'll see if I can whip something up for you. Have a project that just isn't working out like it should? Let me know in the comments and maybe I'll test out my powers of project redesign1.

What makes a project an effective learning experience?

Let me kick the series off with some quick thoughts on what I think projects of this sort should include:

  1. It needs to be hard, but not crazy hard. I've discussed this a bit, but I strongly believe challenging tasks are good for us. However, the task needs to hit that sweet spot of being challenging enough but not so challenging that students deem success as an impossibility. I'd like to call this the Goldilocks Zo-ne of Proximal Development- a term that I'm sure Lev Vygotsky would've coined had he written fairy tales on the side (or been an astrophysicist). Truly great projects would start out fairly simple and increase the challenge as students are ready.
  2. Success requires the use and understanding of the desired concepts and skills. Not as in, "The teacher requires that I do this, so I'm doing it," but instead the task demands the students to utilize the concepts and skills as an integral part of successfully completing the task. To borrow an illustration from Papert, you could demand students to find 2/3 of 3/4 on a worksheet or you could have them make a 2/3 batch of cookies where the original recipe calls for 3/4 cup of sugar. Both require the same skill, but an incorrect answer on a worksheet provides little motivation to learn. A batch of crappy cookies does2.
  3. A project that fails isn't a failure, but a chance to improve. There should be time built in for students to reflect on their project's failings, attempt to address them, and retry the challenge. You may know this as the Iterative Process or Engineering Design Process. I haven't been great at including time for this in the past, but as I've thought and more about project design I've come to value the Design-Test-ReDesign-ReTest model.
Number 2 to is pretty difficult to nail. Most likely I've never done a project with students that has truly met this standard. The better of my projects have inherently require some of the desired concepts and skills, but I'm also often "forcing" some concepts and skills into the projects even when they're not necessarily required to complete the task. I'm not sure that's horrible.

Next up in the series:

Pipe Insulation Roller Coasters
  1. No promises I'll come up with anything mind blowing. Your mileage may vary.     []
  2. Cookie Monster would not be amused.     []

How I use LaTeX

In the last installment, I described what LaTeX is and my adventures in learning to use it. Today, I'll explain how, as a teacher still figuring out all this LaTeX craziness, I get things done using it.

As I mentioned, I've been using LaTeX to write up lab reports in the classes I'm taking this semester. LaTeX is great with formal documents, especially when they need to include symbols, fractions, and other exciting calculations. LaTeX works great (for me) to create formal documents. It has easy commands to create headings and sub-headings, bulleted and numbered lists, and (of course) it makes including formulas and symbols easy peasy.

That being said, I've been working for quite a while to make any handouts or slides for students more visually appealing. Lots of graphics. Design elements. And so forth. You can make slides and handouts using LaTeX. I don't think you should. Here's a slide deck I've used to introduce the basics of chemical reactions. In Keynote or PowerPoint it didn't take much effort to create. In LaTeX I think it'd take for-ev-er. Does that mean you can't get the awesome formula making of LaTeX in anything other than formal documents?

LaTeXiT

Lucky for you, there's LaTeXiT [update: Mac only]. It comes automatically with the full version of LaTeX. Basically, it lets you type in the commands to create the great looking formulas & symbols you'd expect from LaTeX then allow you to drag & drop them into your slide decks or handouts.

Commands typed in the text box. Output appears up top.
Dragging from LaTeXiT to Keynote

One of the great things LaTeXiT does is allow you to export the formula in a variety of image formats- including vector based pdf image files. While that sounds like geekily unnecessary information, it means that you can adjust the size of your formula so it's as huge as you'd like and it'll never get all pixellated.

Starting out

Since at first I didn't know any of the LaTeX symbols, I kept a couple pdfs that explained all the commands for different symbols open while I was using LaTeX. If I needed how to add, say, absolute value symbols, I just used the "find" function on my pdf viewer to locate where it described that command. At this point, I rarely need to look up new commands, since I've memorized all the usual ones simply through repetition. I've included below links to the mandi LaTeX package and it's documentation, which was made specifically for physics classes. Also included are links to a guide for all sorts of math symbols. Both have been super-useful for me while learning to use LaTeX.

[Update] LaTeXiT History & Library

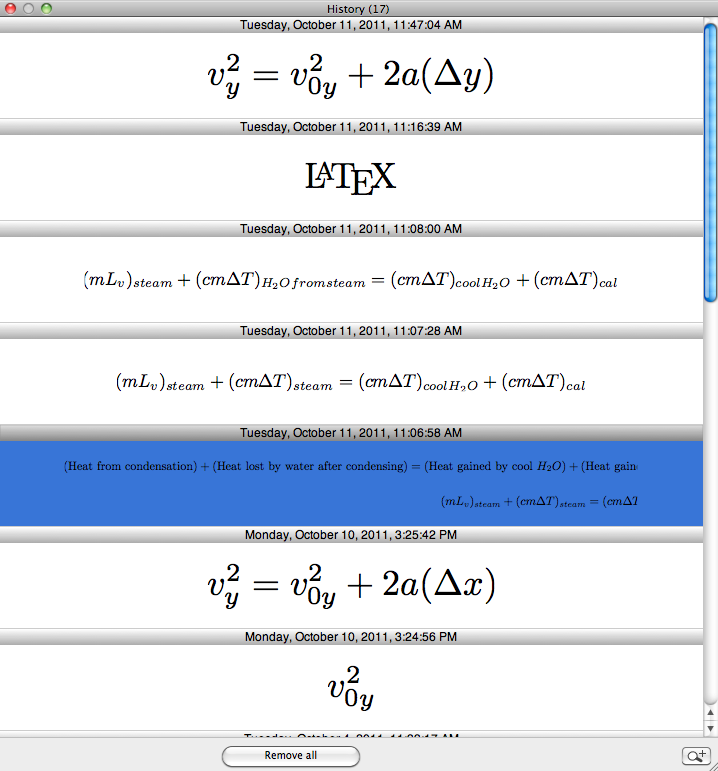
Thanks to John Burk via twitter, I've discovered that LaTeXiT saves every formula you enter. That means you can pull up the history panel and drag & drop any of the formulas you've entered without having to re-type the commands. That's a major time saver.
The history. Drag & drop to your heart's delight.
Further, you can save equations in the "Library," and organize them into folders. Being the super-organized person I am1, I'll probably create folders like Kinematics, Newton's 2nd, Heat them dump equations I create into them as I go. Eventually I'll have an extensive library of equations and symbols ready to go.
  1. not so much.   []

Learning new things: LaTeX

I can usually get programs like Microsoft Word to format my documents so the way I envision the document in my head matches up pretty close to what I end up with on the screen. You know, however, that sometimes getting the document to look right can often take as much time as it takes to type the document in the first place.  If you add to that the hassle of trying to get equations for physics or chemistry to show up correctly, it's pretty easy to such down a lot of time simply knocking out a short and simple handout.

Last July, I caught John Burk's post on a new LaTeX1 package that makes writing physics equations much easier. Although I had been peripherally aware of LaTeX in the past, I really didn't know much. Since I had some extra time in the summer (and since I'm not teaching this year, freeing up more time), I decided to jump in and try to figure LaTeX out.

What is LaTeX?

Don't be fooled. LaTeX is not a word processor. It took me awhile to figure that one out. While you type in the text that you want to show up in your final document, you're also adding some code telling it exactly how you want your final document to look. Want a new section in your document? Type section{Section Title}. This automatically creates a section title with a larger bold font, and automatically adds it to your table of contents (if you have one).

Why bother?

Since I'm sciencey (is that how you spell sciencey?), I tend to use more formulas, symbols, and other weird notations in my documents than the average bear. As previously mentioned, getting these to work in pretty much any standard word processing software sucks. It's a major pain. Especially if there are special characters all over it. Even more so if you want the formulas to actually look right. LaTeX provides simple codes that allow you to make equations and symbols look exactly how you envisioned them in your head.

For example, typing
a=\dfrac{2(\Delta y)}{t^2}

will tell LaTeX to do this:
[latex size=4]a=\dfrac{2(\Delta y)}{t^2}\(\)\LaTeX\(\)\LaTeX$$ to make.

Resources

  1. pronounced "lay-tech," which of course makes total sense.     []

3 Quick: Engineering, For-profit schools, CIPA

Three quick items today:

Uno

I've been thinking about engineering in schools and student (& teacher) perceptions of engineering as a discipline and skill set.

My take: It's misunderstood as being dorky, nerdy, science-y. Educators (& politicians) sell engineering as a great profession that will save America- but then don't do much to actually let students DO engineering during the school day. On that note, I'd love if you educators out there could spare 5 minutes of your students time to have them take this survey. It asks two basic questions: "What do engineers actually do?" and "What do engineers need to know?" As a reward for helping me, I present Sheldon Cooper on engineers for your enjoyment. I'll keep the survey open indefinitely.

Deux

I've never liked for-profit organizations running schools. Also, I've never been very good about articulating what exactly skeezes me out about them. Chris Lehmann is good at articulation, and his post Why I'm Against For-Profit Schools nails my feelings on the topic. Read it.

٣

Every try to convince your network administrator that they should unblock twitter? or blogs? or any social networking site? If your experiences are similar to mine, you'll get told that they're required to categorically block these sites if they school is going to get e-Rate funding through CIPA. Turns out that's bogus. CIPA makes no such claims. In fact, the FCC (the government agency behind CIPA & e-Rate) goes out of their way to point out:

"Declaring such sites categorically harmful to minors would be inconsistent with the Protecting Children in the 21st Century Act’s focus on “educating minors about appropriate online behavior, including interacting with other individuals on social networking websites and in chat rooms, and cyberbullying awareness and response.”

Hat tip to John Pederson for finding and posting this. If you visit his post, you'll find the link to the original FCC document.


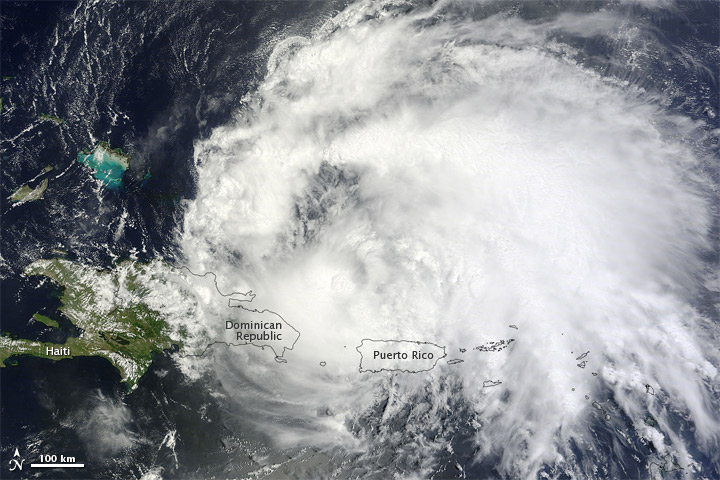
How to make a hurricane boring

Suddenly it's hurricane season in Connecticut. Some local schools have already cancelled the first day of school next Monday.

Natural disasters create a lot of interest among the general public about the Earth's processes. In theory, these could be powerful educational hooks to spur learning in the classroom on weather, climate, or oceanography.

Michael Doyle, reflecting on the surprisingly strong "East Coast Earthquake of 20111" thinks it may have been better that summer break was still on when the earthquake hit:

"I am glad today was not a school day in New Jersey.

Those of us sitting on the state's udder, the tip of Cape May county, got a nice ride for less than we'd pay at Morley's, and countless afternoon chats under the sun made the surreal feel real.

Now imagine if we had school tomorrow--kids would be assaulted with seismographs, joule calculators, fault maps, Richter scales, and whatever else tools teachers could find to make the real become more abstract.

All that matters, at some level, of course, but for most kids, I imagine having a spectacularly lovely August afternoon off to replay a minute's worth of otherworldliness will make this one stick for a long, long time."

I agree. The underlying problem isn't that the earthquake would simply be discussed at school the next day- it's the way we schoolify the event. I think we should include current events in our classes- especially when those events relate to our curriculum (I've written on this a bit in the past).

What to do? Shawn Cornally to the rescue (Read the whole post. I'm not doing it justice here):

The problem is that we’re schooling life-long learning out of our students. What do we do about it?

[...]

GIVE STUDENTS TIME AND CREDIT FOR INDEPENDENT INVESTIGATION:

If you think that sounds ridiculous, then you’re the problem. Students are smart. Teenagers are curious. However, at school, they tend not to be. Porque?

Students are generally interested in hurricanes, earthquakes, or nuclear reactors, especially after a notable event. However, too often we (educators) use this interest as an excuse to break out our favorite "How is the Moment-Magnitude Scale differs from the Modified Mercalli scale" lecture. This is bad.

Instead, students should have time for independent investigation about the event. Have them pick a related topic that interests them. Give them the time and support to follow that interest down the rabbit hole.

While students are following their interests, they'll suddenly find they need to understand seismic waves, or logarithmic scales, or moment-tensor solutions simply as a part of their investigation.

In essence, don't just tell students about the Modified Mercalli scale and expect them to be super interested- provide an environment where they'll find they need to know about it.


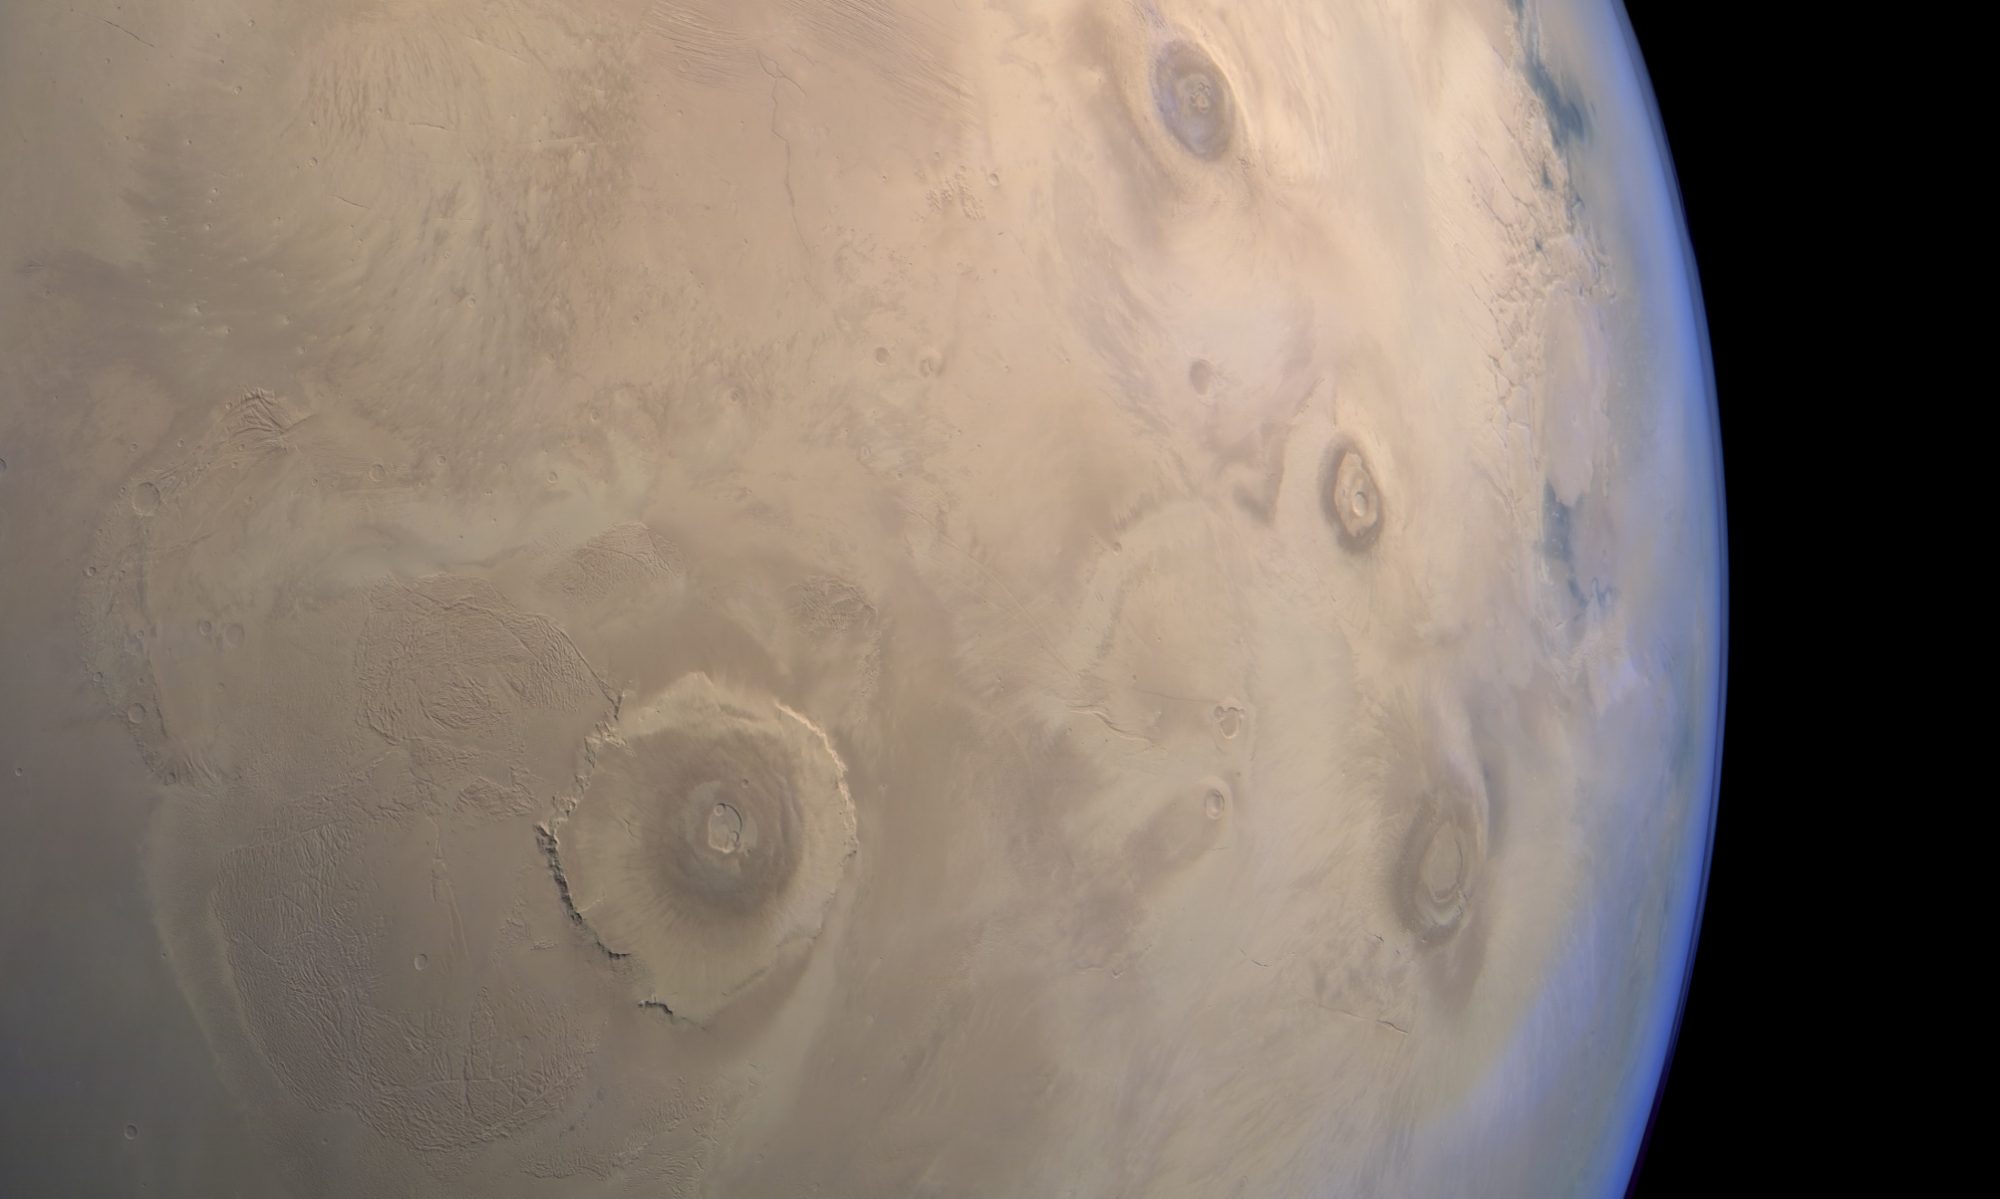
image credit: NASA courtesy Jeff Schmaltz, MODIS Rapid Response, NASA Goddard Space Flight Center, via Earth Observatory


  1. A little self-aggrandizing, no? I'm sure you West Coasters- and especially Alaskans- are all having a nice chuckle.     []

The first days of school

A few years ago I gave a brief overview of what I do on the first day of school, but since then I've rethunk and revamped my thinking on how to best organize those exciting/nervous/nerve-wracking first days.

The vision:

  1. The instructional and inter-personal interactions you have with students tell them (either explicitly or implicitly) what things you value.
  2. Your choices for how to spend the first days of school (and really all the days of school) need to align with your values.

My first day:

First, decide on those high value items. You know, the things that you really want students to know about either you or your expectations of them. Two high value items that I want students to understand right from the beginning are (1) I'd like to know each of them as individuals, and (2) I want them to become learners- not just grade grubbers who pick up a thing or two along the way. Then, find or create activities that reinforce those values.

Here's what I did last year:

I want students to understand that I value them as individuals1, so I started with a relatively low-impact ice breaker2:

SnowBall

Pass out half-sheets of paper to each student. You should have a half-sheet of your own. I do all of these steps right along with my students all the way through:
  1. Write one true fact about yourself on the paper (You could probably come up with more specific or interesting prompts. I like the "one true fact" prompt simply because it's non-threatening and allows a very broad range of responses).
  2. Crumple up the piece of paper (This is when you start getting funny looks).
  3. Throw your crumpled paper (The funny looks are coming fast-er and furious-er  at this point).
  4. Pick up a piece of crumpled paper and de-crumple it.
  5. Find the person who the crumpled piece of paper belongs to and write their name on it. Don't let students take their paper from the person who found it and write their own name. When they do this they don't even have to get the other person's name.
  6. When you've found your person and they've found you, have a seat.
I like this because it gets students interacting with each other right away. In addition it allows me to interact with them in a non-talking-head way right off the bat.

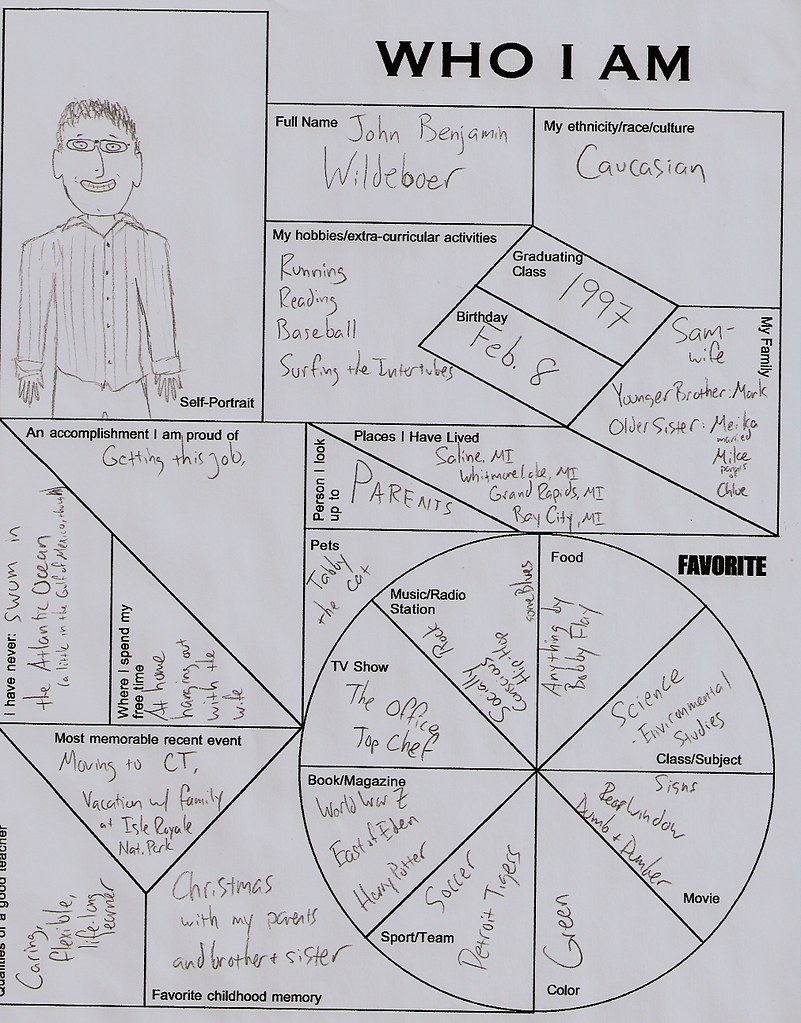
Who I Am

Who I Am, 2008
Once the snowball activity has loosened up the atmosphere a little, we move on to Who I Am sheets (a tip o' the hat to Dan Meyer).  They're a little more fun (& visually appealing) than the typical "write three things about yourself on this notecard" approach3, and I really enjoy reading all the students responses. Typically I'll set them aside for a week or two until I know my students better and then look over them all carefully. I also hang on to these sheets. Ideally I hang onto the students' Who I Am sheets until the end of the year and then pass them back to students. I've often forgot, or lost a few of the sheets, or whatever. However, it's a fun time having students look back at their responses as naive first day freshmen.

Generalities

  • I try not waste class time, even during activities (like these) that could be considered "fluff." Again, it's modeling to students that what we do in class is important.
  • I do go over class expectations with students, though I try not to on the first day. Students are bombarded with class expectations and rules constantly throughout the first day. Why not instead spend the first day focusing on who your students are, then get in the expectations a little later?

Resources

  1. It's a little sad that many students are surprised or uncomfortable that I'd like to know more about them than whether they showed up on time and turned in their homework.     []
  2. I really dislike ice breakers. Seriously. I'm a bit introverted and can get cranky being forced to interact with strangers. True story. In this instance I get around my hypocritical feelings because this ice breaker doesn't require anyone to be the solitary focus of the large group- and it's short and over quickly.     []
  3. In the past I've reversed the snowball and Who I Am sheet. The downside of that is the first 10-15 minutes while students are filling out the sheet it's just awkward silent time. When I reversed the order, the atmosphere was a little lighter while filling out the sheets and it provided some good time for me to banter with students while they filled it out.     []

The "It's been awhile" update

So, yeah...it's been a while...

I'd better do an update, since a few things have happened since my last post in...um...May:

EdCamp CT

A few short months ago Dan Agins and I were attending EduCon in Philly when fellow Connecticutian Sarah Edson waltzed up nonchalantly and pitched,  "I think we should throw an EdCamp in Connecticut this year, you in?!!"  We were in, and it'll be happening in just under a week (as I write this). There are 125 people signed up (plus a wait list!), and we are all1 really excited to meet every one and learn all we can next week.

Wedding/Travel

My brother got married in July, which gave my wife and I an excuse to visit Chicago and traipse across the MidWest and take in ballgames at two new ballparks together2. We both grew up in in Michigan and Chicagoland,  so it was nice to spend the week eating at all the restaurants visiting places we missed.

Back to school

I taught Physics for 5 years (even though I wasn't "highly qualified" in Physics) several school years ago and really enjoyed the entire experience. Ever since I've talked about going back to get my Physics certification. Due to some new circumstances I'm planning on taking a year off from teaching so I can go back and get both my Physics and Chemistry certifications.

I'm not crazy about being out of the classroom for a year (not to mention the lack of a regular paycheck), however, I think this will open up new teaching opportunities that will be both rewarding and challenging. It's a risk3,  but one I hope will pay dividends in the end.

In addition, since I'll be taking Calculus-based Physics this fall I've also been working to brush up on my calculus skills. I did decent in calculus during my undergrad years,  but my last calculus class was held in the fall of 1997. I'm a bit rusty. To brush up, I've been using MIT's OpenCourseWare to "take" their Single-Variate Calculus class this summer. I've discovered so far that I can do the calculus, but my algebra and trigonometry need some work.

Blog plans

This year's been a bit rough on the ol' blog. My posting hasn't exactly been regular. However, I've repeatedly found that the simple act of writing out my ideas in this public format helps me to think more deeply about instruction and education. While the feedback I receive from readers is also greatly appreciated, simply forcing myself to turn ideas in my head to text on the page is valuable enough to continue writing4.

Since I've been slacking on the writing I need a plan. Here it is:

  1. Post 1-2 times a month with a project or lesson that I've either used successfully in the classroom but haven't shared yet or sharing a new lesson or project that I've just created. I'm (perhaps unnecessarily) worried that I'll lose my instructional design chops. I'll hopefully design these lessons around content I'm covering in my classes this year.
  2. A "What I'm Reading" series. I tend to read a lot of science-y or education-related books, and I'd like to share basic reviews of these books here. I'll be a bit selective here. If I get into teenage vampire literature, for example, I probably will not include those books in the series. However, you can follow everything I read using the handy LibraryThing widget located on the right sidebar of the blog. Or you can view my LibraryThing library directly. I also welcome your suggestions. Drop 'em in the comments or send them to me via twitter. These will be posted as I finish the books.
  3. Sharing websites, posts, images, videos, etc. that relate to the general science and education theme of this blog. While  I do have a posterous site where I share all the "Random awesomeness I encounter," I'll try to keep the posts to this site more focused. I'll plan on posting in this category approximately once a week.
  4. Some personal photos, reflections, stories, etc. I'd like this space to be a little more "me" as opposed to just the science and education "me." Postings will occur as the whim occurs.
I'm creating dedicated "writing time" a few days each week to keep up with my plan. Feel free to call me out if I start to slack. 🙂
  1. Let me not neglect Marialice Curran, Stephanie Fuhs, and Tracy Mercier, who are also co-organizers and have done a ton of work getting EdCampCT ready to go.     []
  2. We're attempting to visit every major league ballpark, and picked Miller Park in Milwaukee & PNC Park in Pittsburgh on this trip, which I believe has us up to 15 ballparks total.     []
  3. The economy is not exactly stellar, but a teacher with Earth Science, Chemistry, and Physics certifications should be able to find jobs no problem. Right? RIGHT?!     []
  4. I imagine the readership of this site isn't very large given my erratic posting as of late.     []

The best fun is hard fun.

Dr. Seymour Papert is one of my favorite educational thinkers. It's like he's in my head taking barely formulated thoughts and ideas and turns them into detailed, well articulated arguments that I might have never been able to get to on my own.

If you're not subscribed to Gary Stager's "Daily Papert," you should be. Little bits of Dr. Papert's work everyday, delivered directly to my Reeder. The May 25, 2011 edition contains this gem:

The third big idea is hard fun. We learn best and we work best if we enjoy what we are doing. But fun and enjoying doesn’t mean “easy.” The best fun is hard fun. Our sports heroes work very hard at getting better at their sports. The most successful carpenter enjoys doing carpentry. The successful businessman enjoys working hard at making deals.

The Marshmallow Challenge

In high school I'd spend hours in the back yard trying to perfect my curving corner kicks1, not because it was easy, but because it was something I enjoyed. More recently I've found myself drawn to other learning experiences that I undertake2 because I find them interesting- but often they take a lot of effort because when I start I don't know anything about them.

The traditional school curriculum more often than not misses this hard fun. Not because there's something inherent about what we learn in school that prevents it from being hard fun, but because designing hard fun learning experiences requires a bit more flexibility, a lot more student control, and a heckuva lot less "feeding" students the one right way.

I recently ran The Marshmallow Challenge with all my classes. For 18 minutes almost every student- and especially those students who will try to sleep through every class all day- were dedicated to building the tallest structure they could using spaghetti, string, tape, and a marshmallow. Half of the groups had a structure that was unable to hold a marshmallow off the ground- and most of these groups immediately wanted to spend the rest of class redesigning their structure and making it better. It was hard, but it was fun.

I've been greatly enjoying the work many educators have been doing recently towards providing students with hard fun in their classes. Notably:

  • Shawn Cornally's Inquiry Style™
    • He continually throws interesting situations at students and lets them take over. I love it. Take these investigations into oscillations, for instance. Killer.


  • Dan Meyer's new meme: #anyqs
    • I've been focusing on turning content into a narrative story whenever possible this year. Dan Meyer has been taking this to the next level in math, noting that, "good storytelling is a first cousin to good math instruction." I'd argue this is true for most any subject. Here's an excellent little series on sharpening pencils.

While I worry about the increasingly standardized nature of instruction in this country, I'm happy there are so many educators out there taking instruction to the next level and sharing with the rest of us.

Perhaps the best hard fun is designing hard fun for others. 🙂

_________

  1. FYI: This was pre-"Bend it like Beckham"     []
  2. i.e. brewing beer, landscaping, fixing broken appliances myself.     []